It's no secret that I love data. Whether I'm talking about business or which laptop to buy, I want numbers. All the numbers. 📊
I've noticed, however, that not everyone shares my love affair with data. In fact, a lot of B2B marketers aren’t tracking core marketing metrics at all — or if they are, they don't know how to share that data with their team or management easily.
I get it. Google Analytics and the like aren't super sexy. 💃
If you’re not a marketer, it can be hard to make heads or tails of all the lines and filters.
However, those metrics are crucial for ensuring your team and clients understand what's working and what's not.
That is why I want to talk about Google Data Studio.
It's a fantastic tool that makes reporting a whole lot smoother, faster, and more customized — essentially, it's a customized version of your Google Analytics dashboard. But you can also pull data from just about any other source, including Leadfeeder, YouTube, and more.
Today, I want to share how Data Studio works and how it can save you time. I'll even share a few of my favorite templates — all you have to do is copy them and import your own data.
I'll also cover how to use our Leadfeeder and Data Studio integration. It lets you go a step further than GA data by showing which companies visit your website—so you can see every company that visits your site in real-time.
Note: Leadfeeder is a buyer intent tool that helps B2B marketers see who visits their site and where they are in the sales funnel. Sign up for a free 14-day trial today.
How to build a B2B marketing report in Google Data Studio
Getting started with Google Data Studio is a breeze, especially if you already have a Google account. Here’s a step-by-step guide to creating your first dashboard.
If you already know how to do this, feel free to skip to the next section!
Step 1: Log in to Google Data Studio.
Head on over to Google’s Data Studio page and click, “Use it for free” (that’s right—it’s free.🎊)
Step 2: Sign in to your Google Account.
If you have multiple Google accounts, make sure to use the one attached to the Google Ads or Analytics account you want to pull your data from.
Step 3: Choose a report type.
Once you sign in, you’ll be taken to your main Data Studio homepage. From there, you can choose to create a blank report or one of Google’s Data Studio templates.
(Pro tip: You can find marketing-focused Data Studio templates here.)
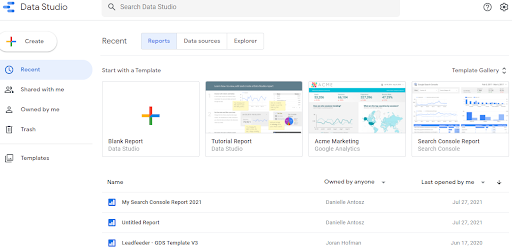
I recommend choosing a template if this is your first Data Studio report. They're well designed and come packed with geeky charts and graphs you can customize.
Step 4: Choose your data source.
Next, you’ll need to choose which data source you want to pull from. From there, your data will populate into the template’s fields, and you can edit any metrics, filters, titles, or design elements as needed.
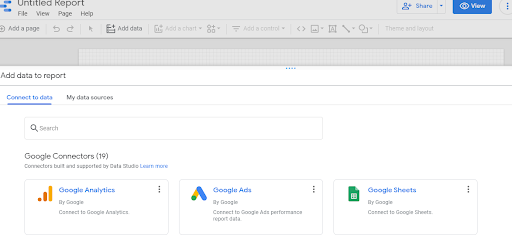
You can also connect Leadfeeder with Google Data Studio and pull data from your dashboard right into your reports.
Step 5: Customize your data studio report.
Add elements by opening the “Add a chart” dropdown and selecting one. Use the toolbar on the right to set the dimensions, metrics, and other filters to be included in the chart or table.
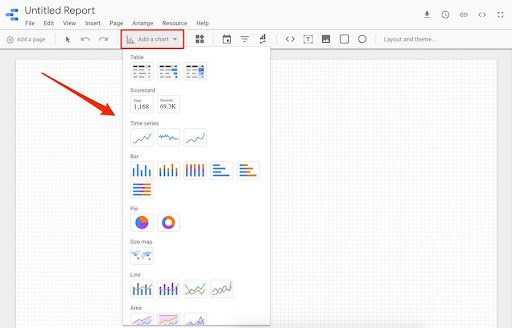
Congrats—you’ve created your first Google Data Studio report.🎉
Now let's look at a few B2B marketing reports you'll want to steal.
5 Google Data Studio reports every B2B marketer will want to copy (with templates)
Google Data Studio makes report building so much more convenient.
Build a report once, grabbing whatever data you need right from GA or other data sources (which Data Studio easily connects to), then use a single link to present that data in a dashboard that continuously updates on its own.
You can also choose the data, charts, and tables you need and display them all together—so there’s no clicking around to find what you’re looking for.
It's a little like magic. 🪄
Here are a few report templates to try out your Google Data Studio skills.
Google Data Studio for Overall Traffic
The first template I want to share is a Google Data Studio dashboard that shows overall traffic numbers (by pageviews) across landing pages, blog posts, or websites.
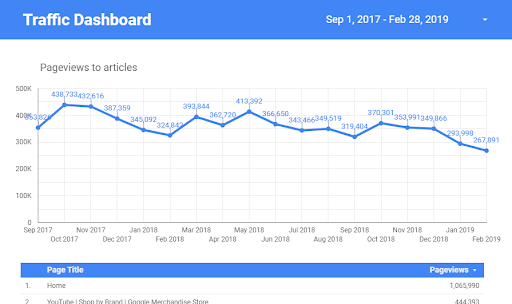
You can access the template here to make a copy and start using it yourself, by editing the data source as we mentioned above.
Once you connect to your own data source, start playing with adding different metrics, changing filters, and changing the date range to see how that changes the graph.
Google Data Studio for PPC (or any paid ads!)
Our Data Studio PPC template uses Google Ads data, but you can set any paid ad account as your data source, including other paid search ads, social media (like Facebook ads), and display ads.
It pulls in impressions by campaign and lays out clicks, average CPC, and conversions. Plus, you can sort the data by date and campaign to see how different campaigns compare over time.

You can access the template here to make a copy and start using it for yourself.
Google Data Studio Organic Traffic Report
Want to better understand where your organic traffic is coming from? Don't we all. This report will help you see how much traffic you're getting and how it changes over time.
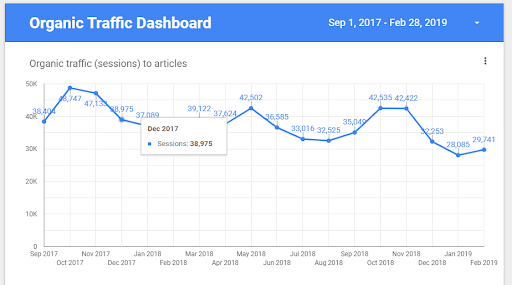
This template is similar to the first one, but it has pre-set filters to show organic traffic exclusively. It shows you sessions from organic search across the landing pages, blog posts, or websites you choose.
Access the template here to make a copy and use it for yourself.
Overview of Google Analytics Template
Google Analytics is a powerful tool, but it can get overwhelming to constantly pull different reports. Even using Data Studio can silo all your data (see the reports above that only pull part of your data!)
If you want to get fancy, I suggest this overview of Google Analytics data that pulls traffic, channels, sessions, and locations all in one place.

You can also sort by date, resort data by sessions, page title, and more.
Access the template here, then make a copy and start using it yourself.
YouTube Channel Report
As a B2B marketer, you may have noticed the explosion in video marketing in the B2B space. Whether you're using it to share explainer videos, demos, or paid ads, you need to know how well your strategy works.
That's exactly what this template does.
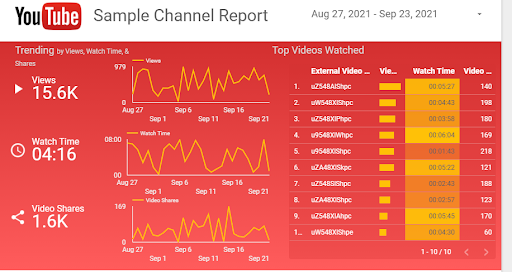
Once you connect it to YouTube, you can see views, watch time, shares, likes, subscriptions, comments, and more all in one location.
You can also view data by specific video, which is super helpful for getting an overall view of your video marketing efforts.
You can access the template here, then make a copy and add your own data.
How to pull Leadfeeder data into Google Data Studio
Leadfeeder data helps you create richer and more detailed Google Data Studio reports because Leadfeeder shows you the companies that visit your website, even if they never fill out a form.
The reality is that numbers only mean so much. Company visitor identification helps make sense of the data in your reports and take action by reaching out.
Our sample Data Studio report pulls in your Leadfeeder data.
Pulling in Leadfeeder data means your reports can tell stakeholders more, including:
How many companies have visited your website
Company names and industries of your top leads, even if they never fill out anything on your site
Where those companies came from (Google, social media, etc.)
We’ve even made it easy with our Data Studio sample report. All you have to do is connect your Data Studio and Leadfeeder accounts and all of the data will be pulled into our polished template, ready for your boss.
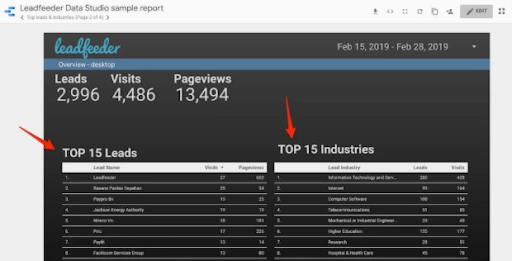
Real companies and industries add context to the numbers.
Check out this article for step-by-step instructions to connect your accounts and use Google Data Studio and Leadfeeder together.
Google Data Studio tells the story behind your data
Data is only as good as your ability to use it. If you're pulling data, but storing it in random spreadsheets and Excel files, you aren't making the most of your data.
If you're trying to present data to executives and clients using those same boring spreadsheets, your presentations might not be as effective as you think.
Google Data Studio brings your data to life by turning spreadsheets into graphs and charts. Data can be filtered at the click of a button and you look like a pro in front of your boss and clients.
Note: Tired of chasing cold leads? Leadfeeder shows you who visits your site (and what pages they check out) so you can focus on companies that are closer to conversion. Sign up for a free 14-day trial here.
Get more from your web analytics.
t’s time to turn your website traffic data into something more meaningful. Website visitor analytics enable you to identify and qualify the companies visiting your website, even when they don’t fill out a form.
Show me how


