Simply put, marketing analytics is the process of measuring and evaluating metrics and key performance indicators (KPI) to determine:
The results your marketing efforts produce
How those compare with goals and KPIs
Areas to optimize and improve your efforts to produce better results
Marketers rely on analytics to do things like grow revenue, improve return on investment (ROI), and make key decisions about where to invest their limited time and budget.
Most content on marketing analytics stops right about here — telling you nothing more than what marketing analytics is. But that’s only the beginning. More importantly: Marketers need to know how to use and interpret the various marketing analytics tools and metrics in order to improve the results their campaigns drive.
For that reason, we’re taking it a few steps further and explaining how marketers can do marketing analytics better — by using the right tools and analyzing the right metrics from the beginning. We put marketing analytics tools, techniques, and metrics into five key categories:
Google Analytics
Paid marketing analytics
Organic marketing analytics
Website UX analytics
B2B marketing analytics
Then we explain how marketers can solve one of the enduring challenges with B2B marketing analytics: making the connection between numbers and real, live accounts.
Note: Need a marketing analytics tool that’s built for B2B? Sign up and try Leadfeeder free for 14 days to see how our tool can help you bridge the gap between marketing analytics and account-level data.
Google Analytics for Marketing
Get to know the numbers behind people reaching and engaging with your website.
It’s impossible to talk seriously about marketing analytics without coming around to Google Analytics. That’s because Google Analytics is second to none when it comes to helping marketers see and understand the numbers behind users reaching and interacting with their websites.
Experienced marketers know that marketing analytics starts with a solid foundation using the data freely available in Google Analytics. That includes website data such as:
How many users reach your site
Where they came from on the web (i.e. organic search, paid social ads, etc.)
How many (and which) pages they visit
How long they spend there
User level data (geographic location, web browser used, and more).
Just about every analysis of marketing campaigns and channels can benefit from the data inside Google Analytics. Nearly as many marketers — even experienced ones — can quickly get overwhelmed by the depth of data available in Google Analytics, too.
Google Analytics Metrics to Pay Attention To
So which metrics should you actually spend your time and energy on? According to Databox, some of the most commonly tracked metrics in Google Analytics include:
Users: This is the number of unique visitors who’ve visited your website.
Pageviews: The number of times a page of your website has been viewed. You can break this down by page, by channel, by UTM campaign, and more.
Goal completions: These are unique goals you can set within your own Google Analytics. You might set a goal for having users reach the signup completion page, for example.
By tracking the metrics above in Google Analytics, you’ll set a foundation for your marketing analysis that’s straightforward, easy to understand, and (bonus) free. From here, you can level up your marketing analytics game using the more advanced and specialized tools in the other four categories here.
The Limits of Google Analytics
While Google Analytics is an invaluable baseline for marketing analytics, there are some data points that are difficult or time consuming to access, or they’re just plain unavailable in Google Analytics. That’s why there’s an entire ecosystem of software and tools designed to give marketers quicker and easier access to more in-depth website and marketing data.
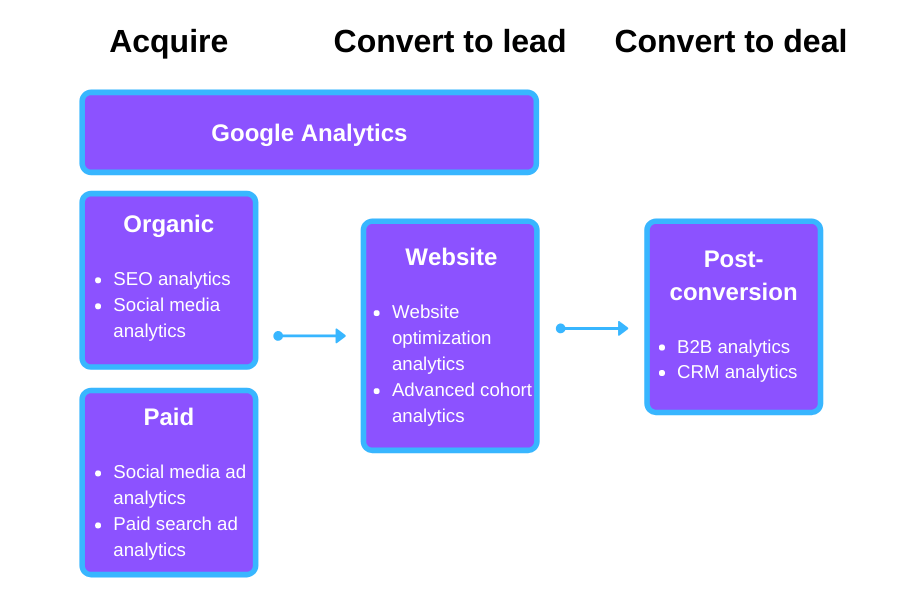
In our view, the tools and analytics marketers need break down into 3 phases:
Acquire
Convert to lead
Convert to deal.

While Google Analytics provides relatively easy access to some of the analytics for phases 1 and 2, there’s more that advanced marketing analytics tools have to offer. And understanding phase 3 definitely requires more advanced analytics software.
Organic Marketing Analytics
Understand how organic search and social media contribute to website visits and engagement.
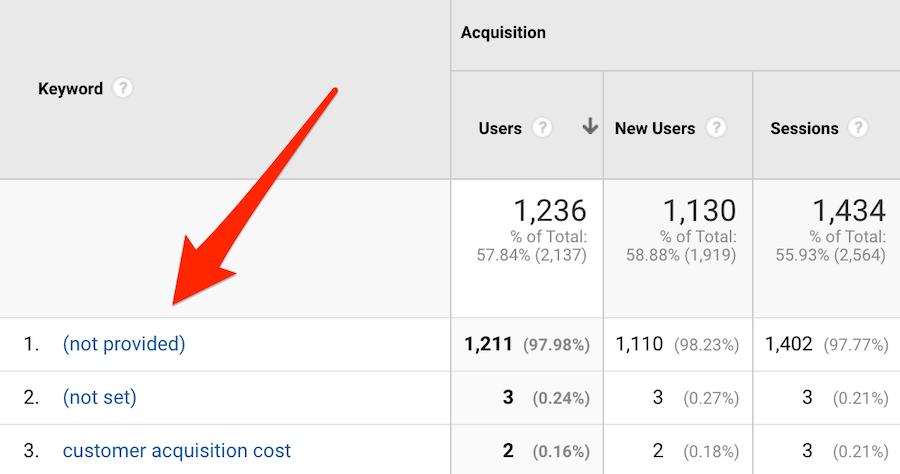
Google Analytics can take you pretty far when it comes to analyzing how organic search plays into your website’s performance. However, experienced marketers will be pretty familiar with this scene:

98.23% of sessions? That’s a lot of missing data.
There are limits to the data you can quickly and easily access via Google Analytics to get a sense of your organic marketing efforts. That’s why advanced marketing analytics often means turning to more robust SEO analytics software and/or social media analytics software.
SEO Analytics Software
More advanced SEO analytics tools can offer more in-depth data on:
Where you rank for set search keywords
How your rankings are moving and changing
The keywords that are delivering traffic to your website
Which keywords are bringing in the best traffic
Keywords your competitors rank for.
For many marketers, that data is simply more easily accessible and actionable than what you can find in Google Analytics — so it’s worth investing in an SEO analytics tool to help you get it. Some of the most popular SEO analytics software options include:
Advanced SEO analytics tools like these offer more in-depth info on search traffic, keywords, and ranking. So if you want to know whether traffic from a specific keyword has a high or low bounce rate, the tools above can help.
SEO Analytics Metrics to Pay Attention To
If you’re going to invest in SEO analytics software, you’ll want to know which metrics to track to get the most out of your investment.

The Rank Tracker in Ahrefs shows an overview of search ranking performance.
Often, that comes down to the handful of metrics that Google Analytics won’t show you, including:
Keyword rankings: Where your website ranks for each keyword, which pages rank, and how those rankings move over time and as you implement SEO changes.
Top keywords for traffic: Which keywords are sending the most organic traffic through to your website?
Top keywords for engagement and/or conversions: Which keywords lead to the most website engagement or conversion behavior once searchers get to your website?
Social Media Analytics Software
Similar to organic search, there’s a limit to how much information you can quickly and easily snag from Google Analytics about what’s driving your social media traffic and performance. Whereas Google Analytics offers “(not provided)” for keywords, the tool identifies social traffic primarily by the social media platform it came from — and that’s the extent of what you can learn (without getting into UTM tracking, that is).
Social media analytics tools can tell you more about:
The campaigns and individual posts driving that social traffic
How users interact with your posts before or instead of clicking through to your website
How your brand is perceived and talked about on social media more broadly.
Some popular social media analytics tools that can offer that information include:
In addition to offering more in-depth data on social media performance, these tools also help tie together what happens on social media and what happens on your website (as a result of what happened on social). So, for example, tools like those above can tell you which social media campaigns drove traffic with the highest conversion rate.
Social Media Analytics Metrics to Pay Attention To
Once you invest in social media analytics software, these are the three most important analytics to make note of:
Engagement (comments, likes, shares): Social media engagement metrics can give you a sense of how well your posts grab users’ attention and spur them to act in some way. You can also view engagement as a percentage of the total impressions on each post or campaign.
Link clicks and click-through rate (CTR): For most brands, you’ll need to send social media users through to your website at some point in order to convert them. Link clicks and CTR tell you how effectively your social campaigns and posts are doing just that.
Mentions: The tools above (and others) can help you keep track of both the number of mentions your brand gets online and the general positive/negative tenor of those mentions.
Paid Marketing Analytics
Understand the numbers behind users interacting with your ads.
Paid marketing analytics are all about understanding the marketing channels where you pay to play — social media ads, Google AdWords, display ads, and more. These numbers can tell you things such as:
How many people have seen your ad (impressions)
The number and percentage of those people who clicked on the ad (clicks and click-through rate)
How much each impression or click costs (cost-per-click and cost-per-thousand-impressions)
How much return you’re getting on your ad spend (ROAS).
Paid Marketing Analytics Tools
In order to get access to all that information (and more), marketers are best off using the analytics features of each platform they run ads with. Facebook Ads, for example, has its own suite of analytics — as do Google AdWords, LinkedIn Ads, YouTube Ads, and just about every paid advertising platform.
Paid Marketing Analytics Metrics to Pay Attention to
So which metrics do you need to pay attention to when it comes to paid marketing analytics? A good baseline includes two categories of paid ad metrics:
Conversion metrics: How effectively are your ads spurring people who see them to buy what you’re selling? Whatever conversion means to your business (trial signups, for example, or trial-to-paid conversions), you need to know how your paid ads contribute to them. Conversion metrics can include click-through rate (CTR) and conversion rate, among others.
-
Cost metrics: Every marketer needs to understand how their budget is spent, the results that budget drives, and the opportunities to get more results for fewer dollars. Cost metrics to track include cost per click (CPC), cost per lead (CPL), and customer acquisition cost (CAC)
.
Website Optimization Analytics
See how users interact with your web pages.
Google Analytics can tell you which pages a user visits and how long they spend there — but it can’t tell you a lot about what that person was doing while they were on that page. That’s where advanced website optimization analytics tools come into play.
The more advanced web optimization software can tell you more about how users interact with your marketing site. That includes information like:
Where they click on the page
How far they scroll down the page
How different segments of users interact with your website.
Website Optimization Analytics Tools
Two of the most common ways website optimization analytics tools collect and display analytics like those above include heatmapping (or click-mapping) and user recordings.
With heatmaps, you can see how frequently users click on (or hover over) a particular part of a web page or how many users scroll past the fold. With user recordings, you can actually watch a real life user interacting with your web page.
Some of the most popular website optimization analytics tools include:
With tools like these, you can identify problem areas in your website’s general user experience. For example, if a landing page is showing a less than ideal conversion rate, a heatmap can tell you if your CTA is placed too far below the fold or if users are reading your copy and still not clicking the CTA.
Website Optimization Analytics Metrics
Website optimization analytics tend to be less about specific metrics or numbers and more about what you can learn from the aggregate data of how users interact with your website. They’re best used to add color (often literally) and context to other marketing analytics.
For example, if a particular web page is suffering from a low conversion rate and the scrollmap shows most users don’t scroll past the fold, you may need to move your call-to-action above the fold or use more compelling copy to entice users to keep scrolling.
As another example, if a page’s bounce rate is high and the heatmap shows many users clicking on the search bar, that can be an indication that the page (and the search results, for that matter) isn’t fulfilling user intent.
B2B Marketing Analytics
Get to know your leads and how qualified (or not) they are.
Google Analytics measures website visits and engagement by the session. In other words, every session is treated as separate, whether it’s the same person or not.
That works for many purposes — but it doesn’t work so well for B2B marketing analytics. Since B2B marketing involves longer deal cycles, larger accounts, and multiple decision makers, you need a way to solve for user-based analysis, instead of session-based.
You need a tool that tracks marketing performance throughout those longer deal cycles and attributes conversions, email opens, and other key metrics to the account (more on account-based analytics later).
Customer Relationship Management (CRM) Analytics Tools
Most B2B marketers and salespeople are familiar with customer relationship managers (CRMs) that track each account’s interactions, conversions, and other steps along the path from lead to customer.
In addition, many of the top CRM tools also offer their own analytics features that can help you identify trends and assess overall performance. Some of the more popular CRMs and marketing automation tools that support CRM analytics include:
CRM tools with built-in analytics take one step toward connecting traditional marketing analytics with the actual accounts in your CRM. However, they’re still limited in the website behavior and engagement they can record — companies have to already be in your CRM. (More on solving the rest of that problem later.)
Advanced Cohort Analytics Tools
One of the defining features of most of the marketing analytics tools we’ve included is that they aggregate your data into averages and trends. While that can be helpful in visualizing the big picture and defining actions to take, it can also obscure some aspects.
For example, if your buyer personas include 3 distinct industries — each with their own typical journey, decision makers, and needs — it doesn’t always make sense to view all of that data as an average.
That’s where the more advanced cohort analytics tools come into play. With cohort analytics, you can break information down into cohorts (or groups) and analyze the data for each group separately.
Three of the most popular cohort analytics tools for B2B include:
So for example, the tools above can help you break out conversion rates for a particular landing page — measuring performance for the specific vertical or persona the page is targeting.
B2B Marketing Analytics Metrics to Monitor
B2B companies and marketing teams vary by industry, customer base, and tons of other factors — so it’s tough to define hard-and-fast B2B marketing analytics that apply to every one. That said, there are three metrics that just about every B2B marketing team should be analyzing and working to improve:
Marketing qualified leads (MQLs): In short, how many leads are you passing over to sales that meet or surpass a minimum level of qualification?
Leads-to-opportunities: Of the leads you send to sales, how many (and/or what percentage) are further qualified and become opportunities?
Time to conversion: This can vary based on product complexity, customer industry, and other factors — but generally speaking, more qualified leads should take less time to ultimately convert.
Solving the Context Problem in Marketing Analytics
As we’ve mentioned, Google Analytics (and most of the other marketing analytics tools above) track individual sessions, meaning (in brief) they record multiple visits from the same person as multiple sessions — with nothing to tie them together.
While that kind of data may work for B2C marketing teams, session-based data just doesn’t cut it for B2B marketers. Instead, B2B marketers need to be able to view top keywords, website UX performance, paid ad CTR, and more through the lens of the companies that visit their websites.
That’s been one of the enduring challenges for B2B marketing analytics: How do you connect anonymous data to the actual accounts you’re targeting?
Simply put, with nothing more than the tools above, you can’t.
Here at Leadfeeder, that’s one of the problems we aim to solve with our website visitor identification software. Using our tool, B2B marketers can access data such as:
Account-level visitor identification and behavior: Which companies visit your website, the marketing campaigns that led them there, which pages they looked at, and more.

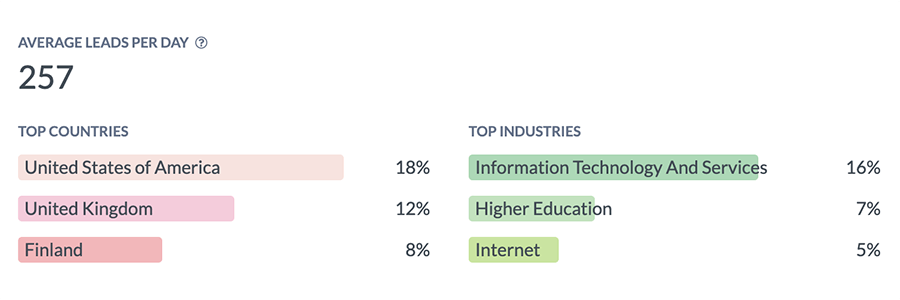
Aggregate account-level statistics: The top countries and industries your leads are in — which can be broken down by channel, marketing campaign, and more.

CRM integration: Whether or not each account is in your CRM, sales activity, deal status, and more.
Note: Want a tool that helps bridge the gap between marketing analytics and account-level data? Sign up and try Leadfeeder free for 14 days to see which companies visit your website, the campaigns that sent them there, whether they’re in your CRM, and more.
Take Marketing Analytics to the Next Level
To do marketing analytics right, you need to do more than just understand what it means. You need to have the right tools at your disposal to help you see and understand the data in front of you — and make decisions that can improve that data.
Getting started with Google Analytics will set you up for marketing analytics success. But when you’re ready, the more advanced marketing analytics tools and metrics above can help you take it to the next level, giving you access to more information about what’s working and what isn’t.
Get more from your web analytics.
t’s time to turn your website traffic data into something more meaningful. Website visitor analytics enable you to identify and qualify the companies visiting your website, even when they don’t fill out a form.
Show me how


